Visualizations for LearnerSurvCoxPH.
The argument type controls what kind of plot is drawn.
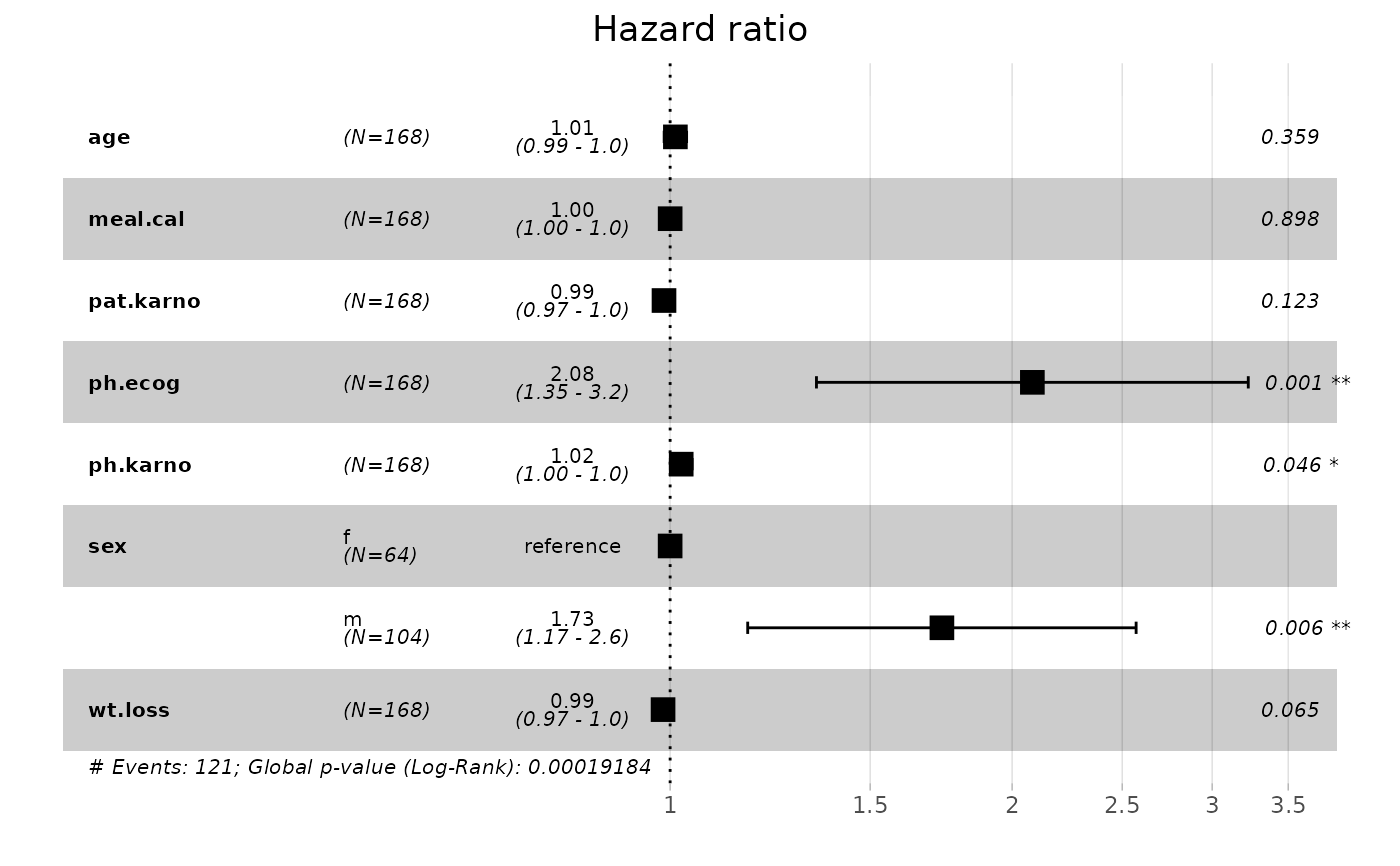
The only possible choice right now is "ggforest" which is a Forest Plot,
using ggforest.
This plot displays the estimated hazard ratios (HRs) and their confidence
intervals (CIs) for different variables included in the trained model.